Bereken en optimaliseer je zonnepanelen en batterij.
i
Deze simulatie is nog in volle ontwikkeling, je feedback via de knop rechts wordt sterk gewaardeerd.
Stap 1
Hoe wil je deze simulatietool gebruiken?
BTW recupereerbaar?
Hoe is de aansluiting gekoppeld aan het net?
Belangrijk voor je privacy
Door je kwartierdata te uploaden, verklaar je je akkoord dat deze data wordt opgeslagen en ook
door andere bezoekers van de website kan worden gebruikt als profiel. Verwijzingen naar persoonlijke
gegevens, zoals je EAN-nummer of andere identificerende informatie, worden verwijderd en niet getoond.
Ben je bereid extra info te delen met KU Leuven voor wetenschappelijk onderzoek?
i
Alle begrip, dit heeft geen invloed op de verdere simulatie.
Zijn er al zonnepanelen aanwezig die in het Fluvius-profiel zitten?
Heeft u een elektrische wagen?
Heeft u een laadpaal?
Kan deze laadpaal slim sturen?
Heeft u een batterij?
Heeft de batterij een eigen sturing?
De batterij kan sturen op
Heeft u een apart energiemanagementsysteem dat niet verwerkt is in de batterij zelf (indien aanwezig)?
Dit EMS kan sturen op
Heeft u een elektrische warmtepomp of airco?
Heeft u een aparte elektrische warmtepompboiler?
Sector of hoofdactiviteit
Grootteorde van de organisatie
Type gebouw of site
Openingstijden of activiteitspatroon
Zijn er al zonnepanelen aanwezig die in het Fluvius-profiel zitten?
Is er al een batterij aanwezig die in het Fluvius-profiel zit?
Welke grote elektrische verbruikers zijn aanwezig?
Zijn er laadpalen aanwezig?
Kunnen deze laadpalen slim sturen?
Is er een energiemanagementsysteem of gebouwbeheersysteem aanwezig?
Dit systeem stuurt actief op
Is het verbruik seizoensgebonden?
Is het bedrijf bereid om flexibiliteit toe te passen?
Mogen we je contacteren voor eventuele bijkomende vragen?
Klik hier voor meer uitleg hoe je kwartierdata in Mijn Fluvius te downloaden
Klik in het menu op de optie Verbruik.Screenshot volgt: 01-verbruik-menu.png
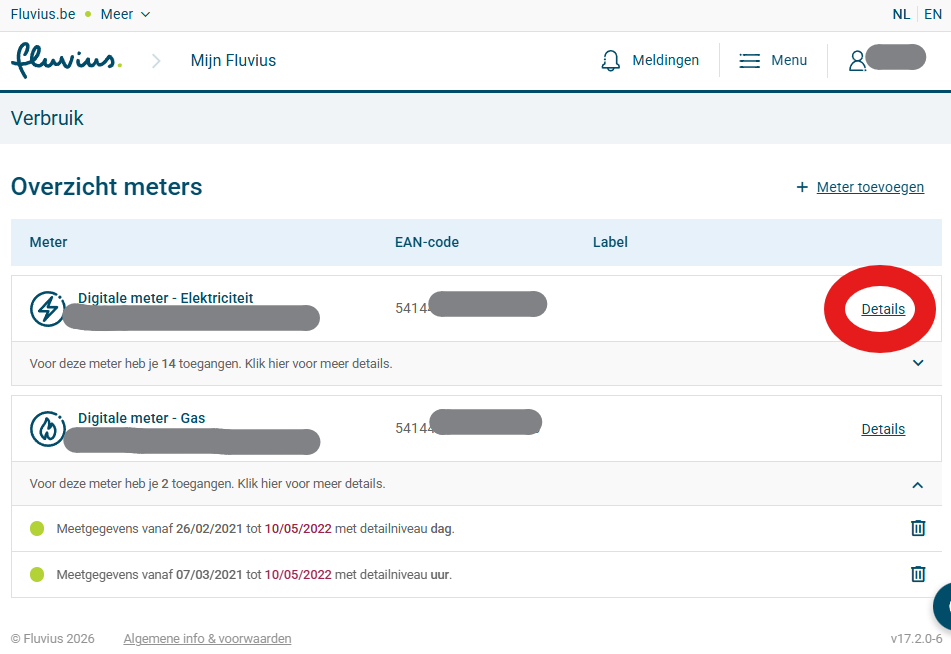
Kies de digitale meter of EAN-code waarvan je de gegevens wil downloaden en klik op Details.
Screenshot volgt: 02-meter-details.png
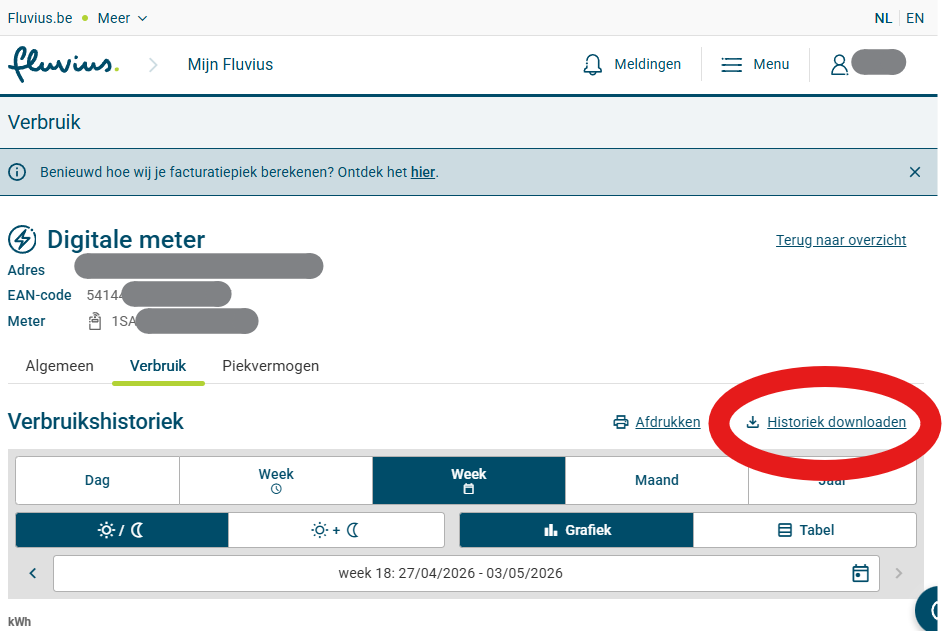
Klik op Historiek downloaden.Screenshot volgt: 03-historiek-downloaden.png
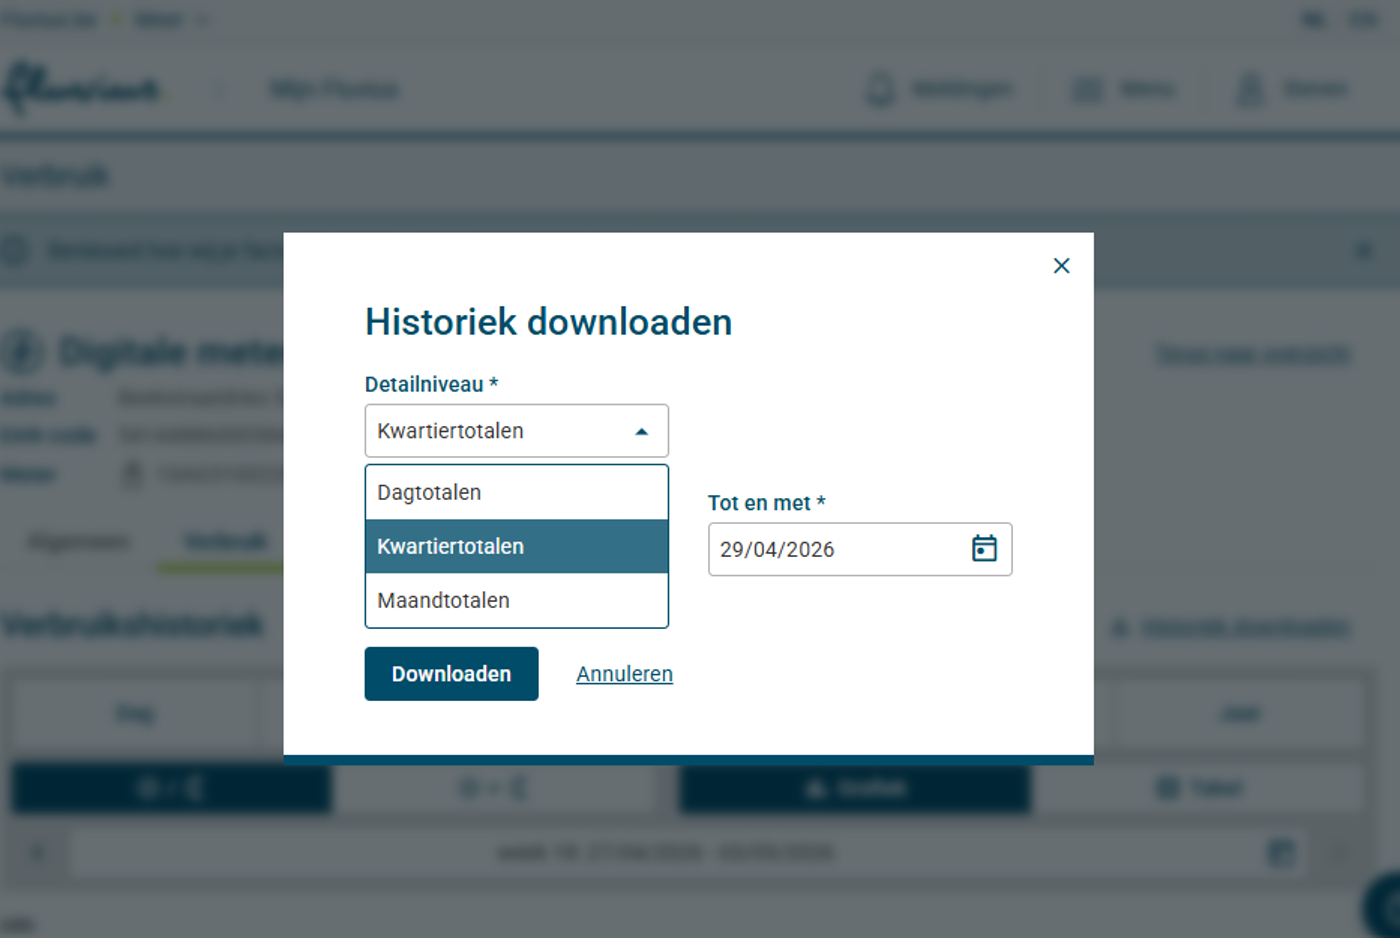
Selecteer Kwartiertotalen. De standaardperiode is 3 jaar. Laat dit staan als je akkoord bent
dat we je gegevens gebruiken voor wetenschappelijk onderzoek. Voor de simulatie hebben we minimum 1 jaar nodig.
Klik op downloaden. Dit kan een tijdje duren. Je vindt het bestand dan meestal in de folder 'Downloads' of 'Mijn downloads' op je computer.
Screenshot volgt: 04-kwartiertotalen.png
Klik onderaan deze pagina op 'Choose file', selecteer het bestand op je computer en klik op 'OK' of 'Open'.
Controleer of het juiste bestand geselecteerd werd en druk op Upload mijn Fluvius-data.
Noteer het profielnummer dat je krijgt, dit heb je nodig als je later opnieuw een simulatie met je opgeladen profiel wil uitvoeren.
Gebruik het profielnummer dat je na een eerdere upload kreeg.
Profielbibliotheek
i
Kies een profielset en daarna een profielnummer, of klik op een profiel in de lijst.
Stap 2
Standaardwaarden voor distributiekosten en heffingen.
Kies je elektriciteitstarief
i
Opgepast: sommige energieleveranciers vermelden op hun factuur de elektriciteitsprijzen als c€/kWh.
Om dit om te rekenen naar €/kWh moet je dan het getal van de energieleverancier delen door 100.
Bvb 14,2 c€/kWh wordt dan 0,142 €/kWh en 2,47 c€/kWh wordt dan 0,0247 €/kWh.
De voorgestelde tarieven hierboven zijn de verwachte prijzen voor de komende 12 maanden en kunnen aangepast worden.
Dit is enkel de
energiecomponent
Je vindt deze prijs op de factuur van je energieleverancier. Gebruik de prijs exclusief groene stroomcertificaten,
WKK, abonnementskost, distributiekosten en andere kosten. Ken je deze niet, laat dan de standaardwaarde
staan; het programma gebruikt dan een gemiddelde verwachte kostprijs voor de komende maanden.
Je kan de meest recente cijfers terugvinden op de website van de VNR (Vlaamse Nutsregulator),
kies daar voor weergave €/kWh en detailweergave:
afnameprijzen elektriciteit vooruitblik
.
. Je vindt deze details op je energiefactuur.
Dynamic tariff conversion van Belpex Day Ahead naar energieprijs
Bij een dynamisch contract vertrekt de simulatie van de Belpex Day Ahead-prijs per kwartier.
De meeste leveranciers gebruiken een gelijkaardige formule zoals hieronder om de energieprijs te berekenen.
Je kan de formules/tarieven terugvinden op de tariefkaarten van de energieleveranciers.
Afname=× Belpex +
Injectie=× Belpex -
De website rekent in €/kWh. Als je leverancier waarden in €/MWh of c€/kWh toont, moeten die eerst
naar €/kWh omgerekend worden.
Klik hier voor vergelijking vaste of variabele tarieven / dynamische tarieven
Tip: voor meer dan 95% van de gezinnen is een dynamisch tarief een goedkopere keuze
Hier wordt alleen de energiecomponent vergeleken. Distributiekosten, heffingen, BTW,
abonnementskosten en investeringen zitten hier niet in
(distributiekosten, heffingen en btw percentage wijzigen niet bij vast, variabel of dynamisch tarief).
Kies eerst je verbruiksdata in stap 1.
Toon uitleg over deze vergelijking
De berekening gebruikt je gekozen profiel uit stap 1 en houdt nog geen rekening met extra PV,
EMS of batterij uit latere stappen.
Opgepast: voor het dynamisch tarief is dit een berekening op basis van historische kwartierprijzen
die overeenstemmen met de periode van het gekozen profiel. Voor het standaardprofiel is dit 2024,
voor de opgeladen profielen zijn dit de kwartieren van het meest recente jaar.
Voor een eerlijke vergelijking check je best je eigen elektriciteitsfactuur of wat de gemiddelde tarieven
waren in dezelfde periode op de website van de Vlaamse Nutsregulator:
afnameprijzen elektriciteit terugblik
. Gebruik daar 'c€/kWh (excl. btw)'. Voor de injectietarieven:
gemiddelde terugleveringsvergoedingen
. De reeds ingevulde tarieven hieronder houden hier reeds rekening mee.
Uit onze eigen simulaties blijkt dat voor meer dan 95% van de profielen het dynamisch tarief interessanter is.
Periode: kies eerst je verbruiksdata in stap 1.
Vast/variabel tarief
Met historische tarieven
i
Opgepast: sommige energieleveranciers vermelden op hun factuur de elektriciteitsprijzen als c€/kWh.
Om dit om te rekenen naar €/kWh moet je dan het getal van de energieleverancier delen door 100.
Bvb 14,2 c€/kWh wordt dan 0,142 €/kWh en 2,47 c€/kWh wordt dan 0,0247 €/kWh.
Afnamekost energiecomponent
-
Injectievergoeding
-
Netto energiecomponent
-
-
Dynamisch tarief
Met dynamische tarieven per kwartier of uur
Deze berekening gebruikt de Belpex Day Ahead-prijzen voor de gekozen profielperiode.
Afnamekost energiecomponent
-
Injectievergoeding
-
Netto energiecomponent
-
-
Verschil
Verschil Dynamisch - Vast/variabel
Een negatieve waarde betekent dat je bij een dynamisch contract minder betaalt bij afname,
of minder vergoeding krijgt bij injectie. Netto geeft de negatieve waarde aan hoeveel het
dynamisch contract minder kost.
Deze opties zijn vrij technisch, sla dit tabblad gerust over.
Extra verbruik
Laat deze optie uitgeschakeld als je geen extra verbruik wil toevoegen; dan wordt er niets extra meegerekend.
Definieer extra verbruiksvensters per weekdag. Vul de totale kWh voor het tijdvenster in; die wordt gelijkmatig verdeeld over de kwartieren binnen dat venster
(alleen 00/15/30/45). Extra load wordt toegepast voor PV: per geraakt kwartier wordt eerst de bestaande
Injectie voor PV verminderd, en alleen het resterende deel wordt toegevoegd aan
Afname voor PV. Het aangepaste profiel loopt daarna door de PV/EMS/batterij-pipeline.
Energiemanagement
Vul de velden hieronder in als je een Energie Management Systeem (EMS) wil simuleren dat verbruik slimmer naar zonne-uren verschuift of de maandpieken beperkt.
Opgepast in combinatie met een batterij: een aparte EMS-piekverlaging kan alleen wanneer de batterij de pieken niet zelf stuurt.
Laat deze velden leeg als je geen energiemanagement wil meenemen; dan rekent de simulatie geen EMS-kost aan.
Voor zonne-injectie vermijden bij negatieve injectieprijzen wordt geen EMS kost aangerekend.
Omdat je bij de batterij voor pieksturing kiest, zetten we EMS-piekverlaging automatisch op 0%. Zo vermijden we dat dezelfde maandpiek twee keer wordt meegerekend.
Verbruik verschuiven van niet-zonne-uren naar zonne-uren wordt kwartiermatig toegepast op de data na installatie van extra zonnepanelen, maar voor de installatie van een batterij.
EMS-piekverlaging is een vereenvoudigde financiële inschatting. Combineer je dit met een batterij die zelf pieken stuurt, dan krijgt de batterij voorrang en wordt de EMS-piekverlaging automatisch op 0% gezet.
Stap 6
Samenvatting en simulatie
Snelle simulatie
Deze simulatie houdt rekening met de 'default' waarden van de verschillende parameters,
deze kan je wijzigen in de volgende tabbladen.
Druk op één van de knoppen hieronder. Het programma wijzigt mogelijks keuzes uit de vorige tabbladen om de berekeningen mogelijk te maken.
Optimaliseer de grootte van de installatie om de hoogste
winst
te bekomen:
Bereken het resultaat voor de installatie van een:
Je kan de prijzen, waarden en keuzes in tab 1-5 zelf aanpassen en dan met de knop hieronder een nieuwe simulatie uitvoeren.
Deze resultaten zijn nog niet bijgewerkt.
Je hebt parameters gewijzigd. Klik op een van de knoppen hierboven om de resultaten te updaten.
Samenvatting gebruikte gegevens
Geavanceerde financiele parameters voor de gekozen simulatie.
Toon de volledige technische details en cashflowtabel
Stap 7
Grafieken
SIMULATION TYPE
Choose the type of simulation. This controls default tariffs, technical parameters,
and profile defaults. You can still override any parameter below.
For more details: cfr. Cashflow and Profile table below.
Loading interactive peak kW chart…
Show series:
Loading interactive yearly chart…
Show series:
Loading monthly totals…
Loading profile chart…
Fluvius Profiles
Static overview per profileset (baseline: extra Wp=0, batt=0, EMS=0)
PV=zonnepanelen, WP=warmtepomp,
EV=laadpaal voor elektrisch voertuig.
Only do this if new profiles were added. This can take 10+ minutes.
Batch analysis plugin
This tab is in development.
You can choose an already existing excel file with chosen values for the parameters and then change the boxplots/distribution graphs.
Click on 'Parameter Values' if you want to see an overview for that file
Currently it is on the public website not possible anymore to use 'run batch' to make new simulations with other defined parameters.
If 'run batch' is visible, the batch will fail.
Send me an email via the 'Send feedback' button (on top op the page) if you need a simulation with different parameters.
I will then upload this new simulation asap.
Important: this analysis uses the current input values from the Simulations tab.
If you want different parameters, first adjust them in Simulations, then come back here and run the batch.
Tip: in Use existing Excel you can pick any Excel file (independent of the selected Profileset).
Parameter values
Batch analysis residential
This tab is similar to Analysis Plugin, but it always uses
Residential logic for the batch generation.
This tab is still in development. You can choose an existing Excel file, but creating a new batch on the public website will fail.
Click on Parameter Values if you want to inspect the parameter sheet.
If you want an analysis with different parameters, send me an email via the 'Send feedback' button on top of the page.
Important: this analysis uses Residential logic, independent of the currently selected
Simulation Type in the Simulations tab.
The extra parameters below are interpreted as percentages of kwh_demand_before_PV per profile.
Tip: in Use existing Excel you can pick any Excel file, independent of the selected Profileset.
Parameter values
Fix-Dyn Prices
This analysis compares the fixed/variable tariff from the Simulations tab with the dynamic tariff formula,
using the same tariff-year calculation as the Residential tariff comparison.
The new Excel includes fixed, dynamic and difference columns; difference means dynamic minus fixed/variable.
Parameter values
Market prices and generation
Day-ahead electricity prices
Load day-ahead electricity prices for one or more bidding zones and view them in an interactive Plotly graph.
Attention (1): Real Load Profile (RLP) used is the one from BE (and applied to all countries).
Attention (2): Solar Capture Price/Rate is in test, so possibly still errors in the calculations/graphs. Assumption PV: azimuth south, tilt 35°.
Use Ctrl or Shift to select multiple zones.
Active only when exactly one day is selected.
i
Generation by fuel type
i
Summary
Generation by fuel type
Generation summary
About this project
Renewable energy impact, made practical
This website is currently under development. Its aim is to provide an
objective and realistic assessment of the impact of investments in
renewable energy, considering economic, technological, and ecological
perspectives.
The website is being developed by Steven De Meyer at KU Leuven as part
of his PhD research. The goal is to make the results of this research
accessible to a broad audience and to translate them into practical,
usable insights.
For feedback, questions, or suggestions, please use the feedback button
at the top of the page.